Custom business systems and integrations
Making the systems you already run stop disagreeing with each other, and turning what they hold into reporting people use.

What we build
Custom operational platforms
Integration layers
Legacy modernisation
Workflow automation
Field data capture
Dashboards and reporting
Most established businesses do not need a new product. They need the systems they already have to stop being three separate places where the same information lives in three slightly different versions.
That is the work. Not a greenfield app, but a custom system that sits across what is already running and makes the operation legible to the people running it.
This page covers making things that already exist work together, replacing manual process, and turning what those systems hold into reporting people actually use. If you need something to predict, generate or classify rather than connect and report, that is AI-enabled software.
What this usually looks like
Someone in operations opens three tabs to answer one question. A month-end report takes four days because the numbers are assembled by hand. A field team captures data on paper that gets typed in twice. A finance system and a customer system that disagree, with a person in the middle reconciling them.
None of it is broken exactly. It works, roughly, and it costs hours every week that nobody has put a number on.
How we approach it
We start with a map of where the data actually is and where people actually need it, before anyone designs a screen. The visible product, the dashboard or the interface, is the smaller half of an internal systems build. The larger half is the integration and the data model underneath it, and that is what decides whether the new system feels native to the business or bolted onto the side of it.
What we build
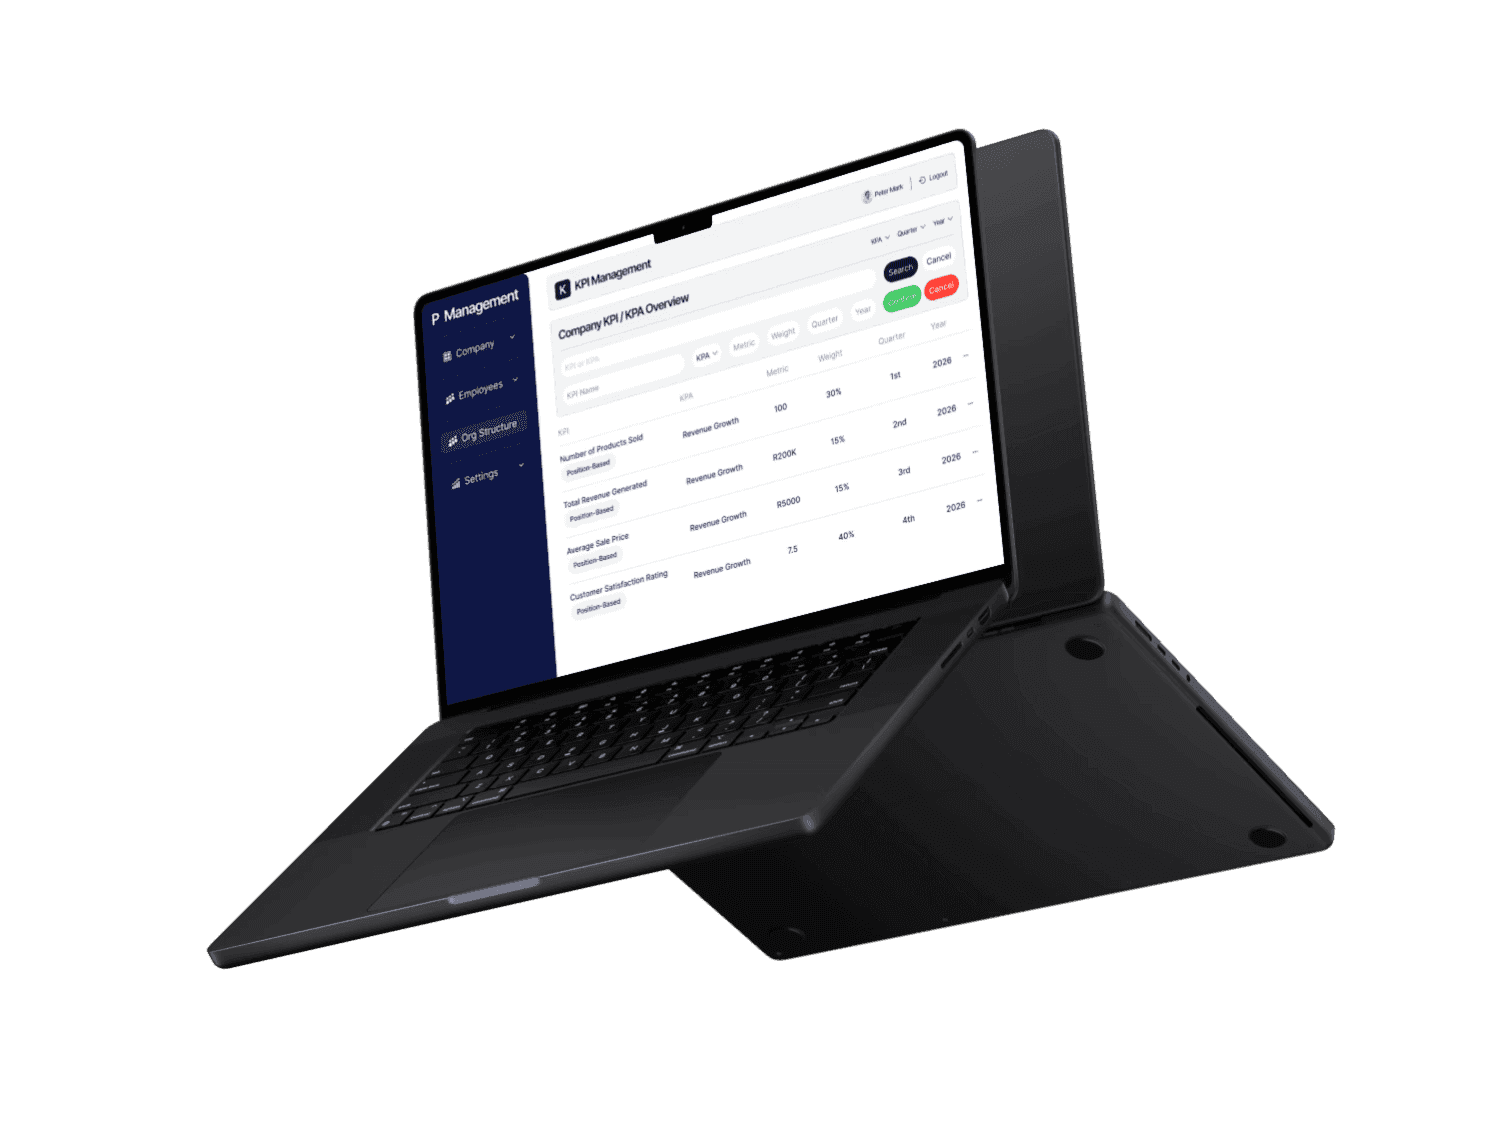
Custom operational platforms. Integration layers between existing systems. Legacy modernisation, including replacing systems nobody can maintain any more. Workflow automation. Field and mobile data capture feeding central reporting. Performance and people management platforms.
Reporting that people actually open
Once the systems agree with each other, the next question is always the same: can we see it. This is the second half of most integration projects and it is why it lives here rather than on a page of its own. You cannot report across systems you have not connected.
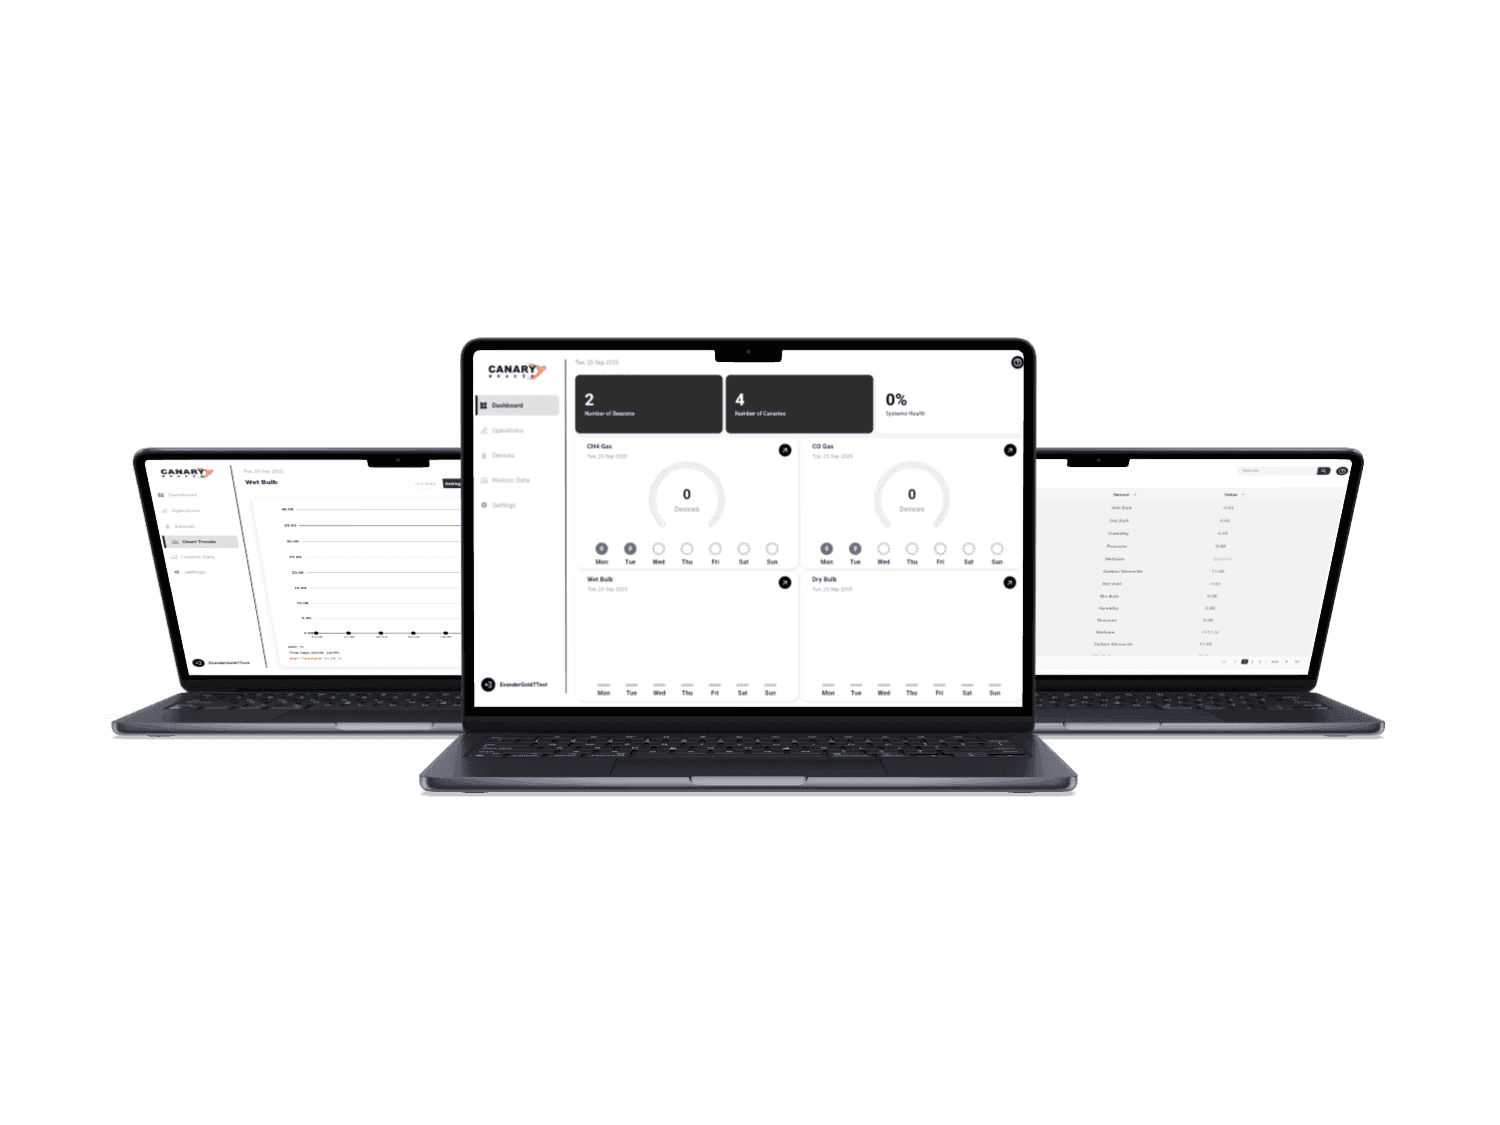
We connect source systems so data arrives without anyone exporting anything. We define metrics once, so one number means one thing across the business. We build dashboards and scheduled reports for the specific people who use them rather than one report for everybody. And every figure traces back to its source, because a number nobody can check is a number nobody trusts.
The failure mode here is the same one as in AI. A dashboard gets built, it is accurate, it is even quite beautiful, and within a quarter nobody opens it. That happens when the view was built around available data rather than around a decision somebody has to make. So we start from the other end. What decision does this inform. Who makes it and how often. What would change their mind. What does it need to look like for them to use it in the ten minutes before the meeting.
When something else fits better
If all you need is a better dashboard inside a tool you already pay for, that is configuration rather than a build, and we would be expensive. Say so early and we will tell you straight.
If the data is not being captured reliably yet, or still lives on paper, that comes first and it is the integration half of this page rather than the reporting half. Worth knowing before anyone budgets for dashboards, because reporting built on unreliable data produces confident nonsense.



How this gets delivered
Phase 0
Your idea
Phase 1
Analysis and design
Phase 2
Development and hosting
Phase 3
Momentum and impact

Lets bring your
project to life.

Cirrus Bridge
We help visionaries turn their ideas into innovative, impactful software: mobile apps, web apps, e-commerce, and the systems a business runs on.